
How the math works
Start with what a sold job is worth in gross profit. Decide how much of that you are willing to spend to win it. Then divide that spend back down the funnel: some booked appointments don’t close, and some leads never book, so each earlier step is worth less than the sold job.
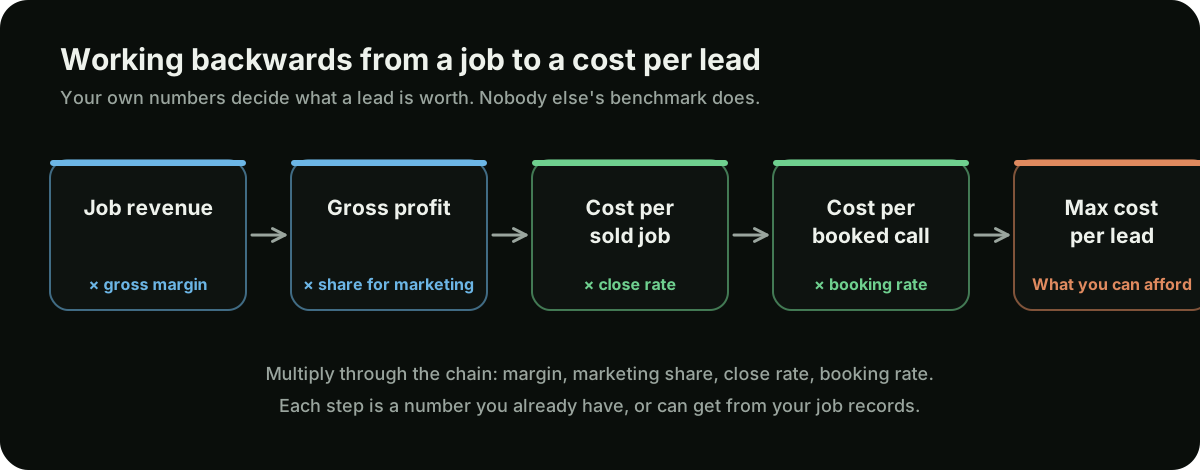
The formulas
- Gross profit per job = average revenue per job × gross margin.
- Break-even cost per sold job = gross profit per job × jobs per customer. This is the most a customer can cost before the work loses money, before overhead.
- Target cost per sold job = break-even × the share of gross profit you will spend on acquisition.
- Max cost per booked appointment = target cost per sold job × close rate.
- Max cost per lead = target cost per sold job × close rate × booking rate.
- Leads needed per month = extra jobs wanted ÷ (close rate × booking rate), rounded up.
- Monthly budget at target = extra jobs wanted × target cost per sold job. It equals leads needed × max cost per lead, give or take the rounding.
A worked example
The table runs the chain twice with invented inputs, so you can see how job mix changes the answer. The higher-ticket column has a lower close rate and spends a smaller share of profit, and it can still afford a much higher cost per lead.
| Step | Lower-ticket job mix (illustrative) | Higher-ticket job mix (illustrative) |
|---|---|---|
| Average revenue per job | $450 | $6,000 |
| Gross margin | 45% | 40% |
| Gross profit per job | $203 | $2,400 |
| Share spent to win the job | 30% | 15% |
| Target cost per sold job | $60.75 | $360 |
| Close rate (booked → sold) | 50% | 35% |
| Max cost per booked appointment | $30.38 | $126 |
| Booking rate (lead → booked) | 60% | 50% |
| Max cost per lead | $18.23 | $63.00 |
What these numbers do not include
- Overhead. Rent, trucks, office staff, and software come out of gross profit too. The share you choose to spend has to leave room for them and for actual profit.
- Seasonality. Job value, booking rate, and close rate move through the year. A single set of inputs is an average; run it again for your busy and slow months.
- Call-handling quality. The booking rate assumes calls get answered and followed up the way they are today. If that changes, so does the answer.
- Attribution gaps. Some leads arrive with no record of where they came from. If you cannot see them, your actual cost per lead will look worse than it is, and your booking rate may look better or worse than it really is.
How home builders use the same chain
For a builder, the job is a signed contract, the lead is an inquiry, and the booked appointment is a design consultation, sales appointment, or model-home tour. The formulas do not change. Enter your average contract value as the revenue per job, your gross margin on a home, the share of inquiries that book an appointment or tour, and the share of those that sign.
Two practical differences: the sales cycle is months rather than days, so work out conversion rates over a long window (a year of inquiries, if you have it), and small changes in close rate move the answer a lot because the contract values are large.
| Step | Illustrative value |
|---|---|
| Average contract value | $600,000 |
| Gross margin | 18% |
| Gross profit per contract | $108,000 |
| Share spent to win the contract | 10% |
| Target cost per signed contract | $10,800 |
| Appointments or tours that sign | 20% |
| Max cost per appointment or tour | $2,160 |
| Inquiries that book an appointment or tour | 25% |
| Max cost per inquiry | $540 |
| Inquiries needed for one contract a month | 20 |
How to get your real inputs
Average revenue per job
Take the last six to twelve months of invoices for the kind of work you want more of and divide total revenue by the number of jobs. If repair and replacement work are very different, run the calculator once for each.
Gross margin
From your profit and loss statement or job costing: revenue minus direct job costs (labour, materials, subcontractors, permits), divided by revenue. Your bookkeeper can usually give you this in one line.
Booking rate
This is the number most companies do not have. You need call tracking or a CRM that records every call and form, so you can count how many real prospects booked. Exclude spam, job seekers, and existing customers calling about something else.
Close rate
Estimates or appointments run versus jobs sold, over the same period. Most field service software reports this directly.
Jobs per customer
Only use a number above 1 if you can count repeat customers in your records, for example through maintenance agreements or repeat buyers.
What to do with the answer
Compare the max cost per lead to what you actually pay. Take spend divided by real leads for each channel: Google Ads, Local Services Ads, and SEO (where the cost is what you pay for the work, spread over the leads it produces).
- If your actual cost per lead is below the maximum, you have room to grow. Adding budget to the channels that are already under the ceiling is usually the safest next step, as long as you have the capacity to run the work.
- If your actual cost per lead is above the maximum, fix conversion before cutting budget. Answer every call, call web leads back within minutes, and check what share of leads actually book. Raising the booking rate raises your maximum cost per lead, and it improves every channel at once.
- If you cannot measure actual cost per lead at all, that is the first problem to solve. Without call tracking and conversion tracking, no budget decision is based on evidence.
For the channel-specific detail, see our guides on running Google Ads for an HVAC company and setting an HVAC Google Ads budget. Builders should read how to set a home builder marketing budget and Google Ads for home builders. For how we run the channels themselves, see our Google Ads management and local SEO services.